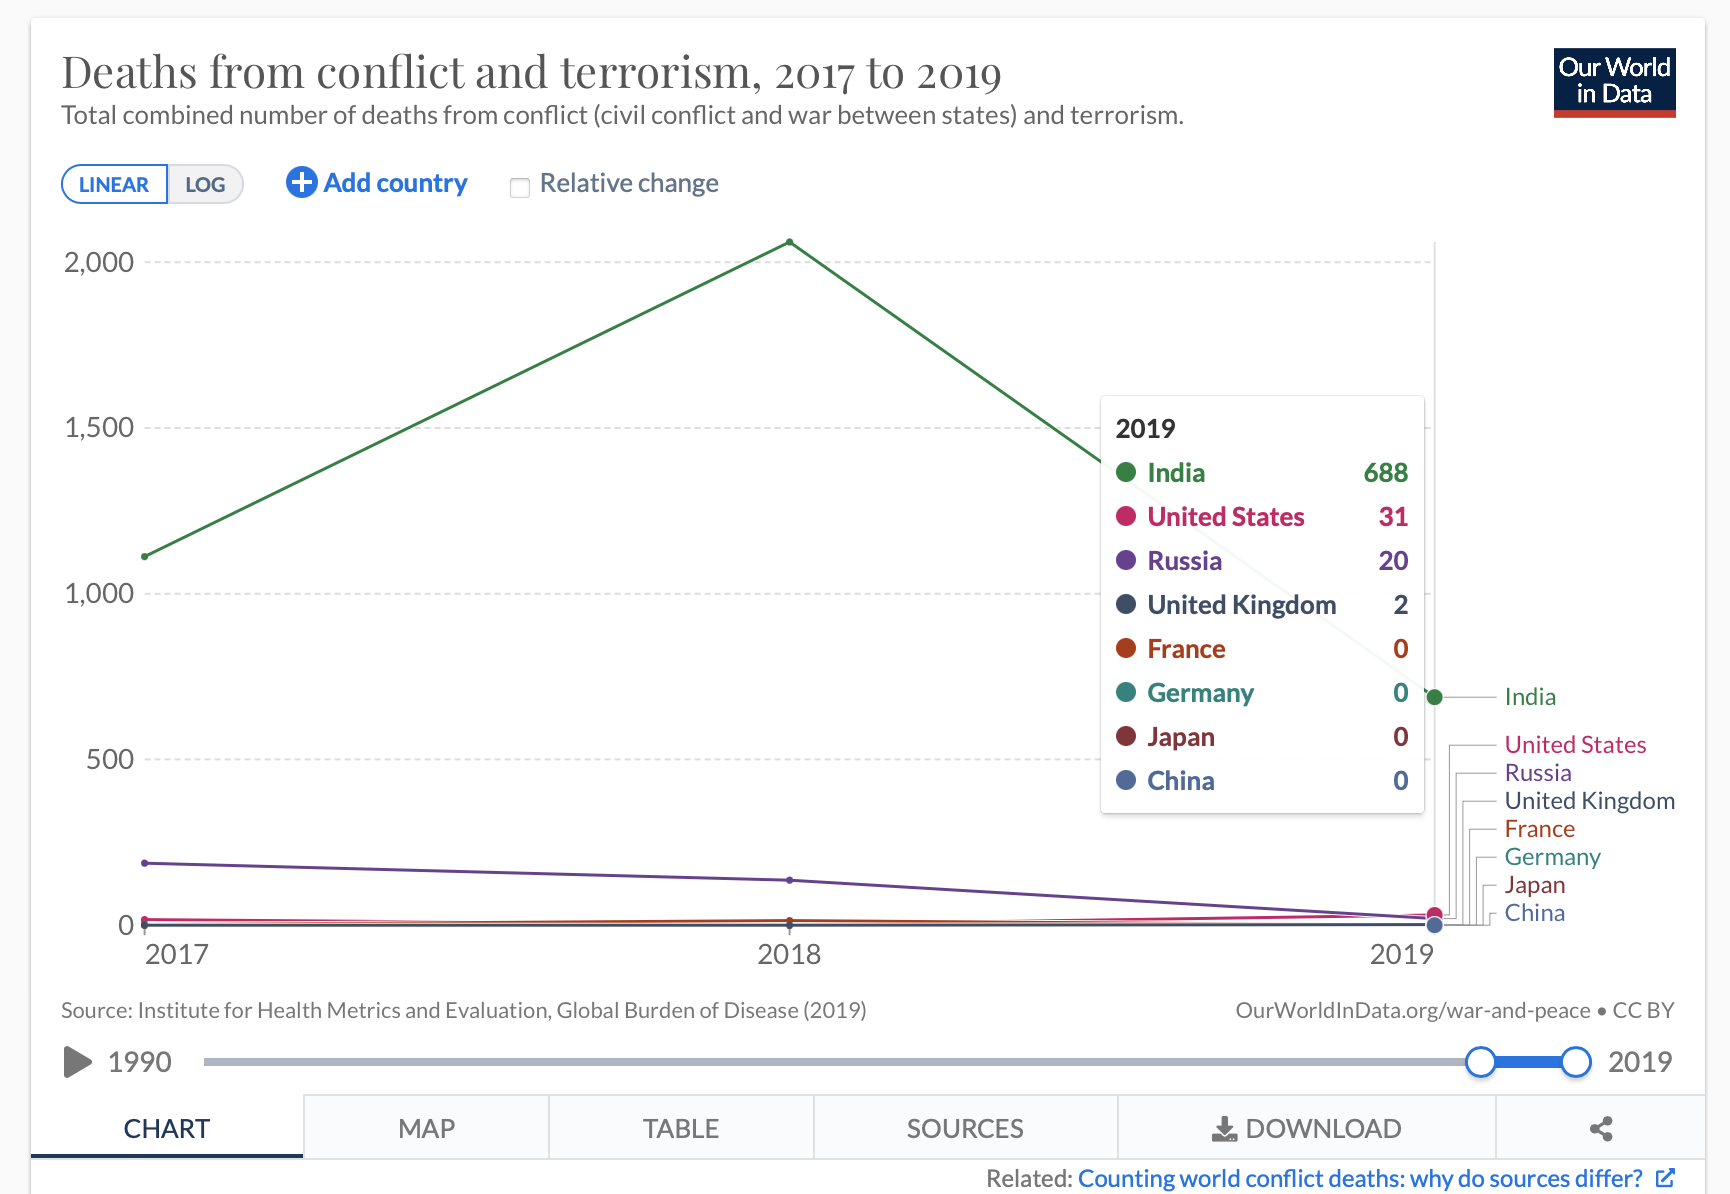
I downloaded deaths from conflict and terrorism data from Our World in Data. I selected this data because I am interested in terrorism related deaths since 1990.
This is the link to the data.
The following code chunk loads the package that I will use to read in and prepare the data for analysis.
- Read the data in
- Use glimpse to see the name and types of columns
glimpse(deaths_from_conflict_and_terrorism)
Rows: 6,840
Columns: 4
$ Entity                                                                 <chr> …
$ Code                                                                   <chr> …
$ Year                                                                   <dbl> …
$ `Deaths - Conflict and terrorism - Sex: Both - Age: All Ages (Number)` <dbl> …- Use output from glimpse to prepare the data for analysis
Create the object
regionsthat is list of regions that I want to extract from the datasetChange the name of the 1st column to Region and the 4th column to Deaths
Use filter to extract the rows that I want to keep: Year >= 1990 and deaths in regions
Select the columns to keep: Region, Year, Deaths
Use mutate to convert deaths to thousands of deaths
Assign the output to conflict_deaths
Display the first 10 rows of conflict_deaths
deaths  <- c("India",
             "United States",
             "Russia",
             "United Kingdom",
             "France",
             "Germany",
             "Japan",
             "China")

conflict_deaths  <- deaths_from_conflict_and_terrorism  %>%
  rename(Region = 1, Deaths = 4)  %>%
  filter(Year >= 1990, Deaths %in% Deaths)  %>%
  select(Region, Year, Deaths)  %>%
  mutate(Deaths = Deaths * 1e-3)

conflict_deaths
# A tibble: 6,840 × 3
   Region       Year Deaths
   <chr>       <dbl>  <dbl>
 1 Afghanistan  1990   1.49
 2 Afghanistan  1991   3.37
 3 Afghanistan  1992   4.34
 4 Afghanistan  1993   4.10
 5 Afghanistan  1994   8.96
 6 Afghanistan  1995   5.52
 7 Afghanistan  1996   3.26
 8 Afghanistan  1997   6.72
 9 Afghanistan  1998  12.1
10 Afghanistan  1999   5.10
# … with 6,830 more rows
Check that the total for 2019 equals the total in the graph
# A tibble: 1 × 1
  total_deaths
         <dbl>
1         316.
Add a picture
See how to change the width in the R Markdown Cookbook
Write the data to file in the project directory
write_csv(conflict_deaths, file = "deaths_from_conflict_and_terrorism")